The idea
A portfolio number tells only part of the story. I wanted to see the company data, the rules behind a decision and what happened after that decision, in one workflow.
I built a trading bot for Oslo Børs that brings company analysis, portfolio rules and a simulated portfolio together. My work covers the workflow and dashboard, using AI-assisted development. It is a personal research and engineering project, not a record of real-money investment performance.
Inside the dashboard
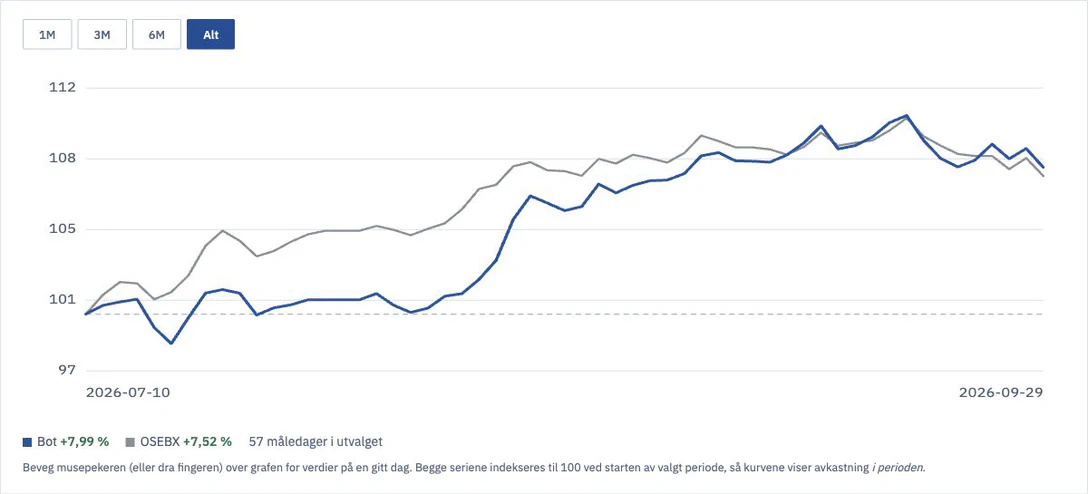
The chart is one entry point. The dashboard also exposes holdings, trading history, the current plan and the scoring method. A result can be examined alongside the assumptions and decisions that produced it.
From data to a decision
- Company data
- Scoring & portfolio rules
- Plan validation
- Simulated execution
Company scoring and portfolio rules prepare a trade plan. The optional AI-based sentiment analysis is a separate input; the core scoring and portfolio rules can run without it.
Before a simulated trade is recorded, a separate execution step validates the plan and checks the market session. Analysis, validation and execution therefore have distinct jobs.
The important design choice
Preparation and execution are separate. A recommendation is not yet a trade. Keeping the plan as a separate output makes it possible to inspect and validate a decision before it changes the simulated portfolio.
The explanation belongs beside the result. Holdings, trade history, strategy and assumptions live in the same dashboard. That makes the tool useful for inspecting the system, rather than only watching a headline number.
What the result can tell you
The visible outcome is a working analysis workflow and an inspectable dashboard. The portfolio uses simulated trades and delayed market data. The chart above uses a dated data snapshot, not a current quote.
Historical and simulated results do not establish a lasting investment advantage. Data quality, trading assumptions and operational interruptions matter. The dashboard’s strategy documentation discusses those limitations.